
So you’ve invested in a new website, made sure it has the perfect look and feel, good UX, excellent content, the right images etc. Once launched, at some point, you’ve probably asked yourself “so. . . how’s my new website performing?”.
All website owners want to know what’s going on with their website, where is traffic coming from? Which of the website’s pages are the most important? Which pages do visitors exit my website from? How long, on average, do visitors spend on my website?
Of all the tools available on Google, there’s one called “Google Analytics” which is actually the most popular website performance assessing tool. The origins of Google Analytics date back to 2005 when Google bought a firm called Urchin which had developed a website Analytics tool. Since then the tool underwent massive improvement and development. Google Analytics is a “Freemium” service, the free version allows most of the functions needed for monitoring the performance of a regular website. For large companies with complex websites a more advanced version is available for a fee – Google Analytics 360. For owners of a regular website the free version is more than enough.
Website visitor monitoring is a privilege the digital world has awarded us. Thanks to tools available on the market like virtual phone numbers, heat maps, etc.) we can gain insight regarding visitor behavior and change our work tactics accordingly. For instance, if we know that traffic coming from Facebook generates better CR (Conversion Rates) we can invest more heavily in attracting this type of traffic.
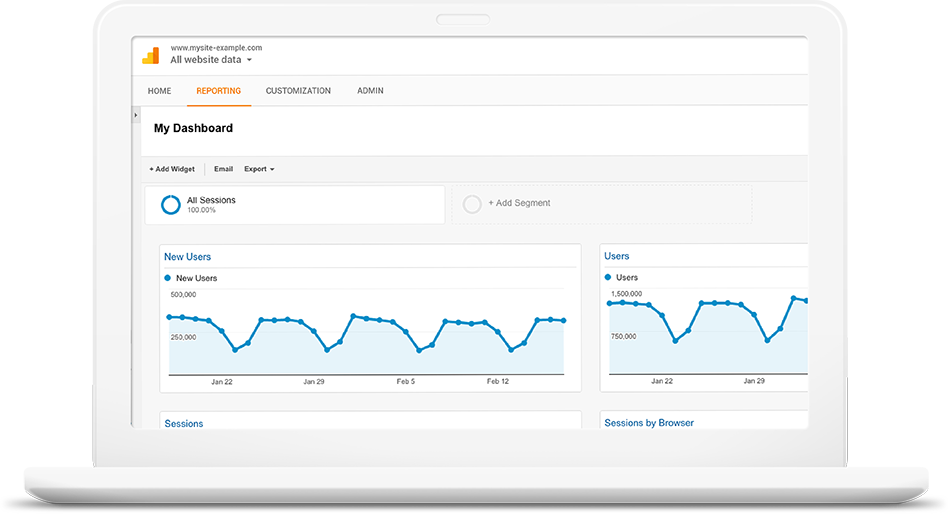
Who is This Guide Intended For? If you own a website but have not yet began to monitor its performance, if you’ve already installed Google Analytics but have yet to begin exploring it, this guide is for you, it is designed to introduce you to Goggle Analytics’ basic features and the information you can derive from using this tool. The first time you open Google Analytics may be somewhat daunting, in just a few moments you see plenty of graphs, charts and numbers. There is plenty of information on Google Analytics, it takes quite a bit of knowhow to master all that this tool offers. This guide can serve as an introduction to the Google Analytics tool and will allow you to begin using it.
Before we take you through the basic features lets address a few terms which will pop up almost anywhere you roam on the Goggle Analytics user interface:
Sessions – Every time a visitor enters your site their actions will be monitored up until they exit it. Google Analytics regards a visitor’s entrance to your website as a new session.
New Users – The Number of visitors who have entered your site for the first time.
Page Sessions – The number of pages a visitor has surfed through on a visit to your site, i.e. a visitor enters your site at the home page, moved onto the “about us” page and then to “contact us”, the number attributed to the “page sessions” variable will be 3 (if a visitor returns to a page they had already been on this will still increase “page sessions” by one).
Bounce Rate – This mostly has to do with how many visitors left your site directly from the page they had entered it from, another way to put it is visitors who only viewed one of your website’s pages before leaving it (“Bounce” as in hopped in and instantly back out). If you create an “event” on Google analytics the visitor will not be regarded as one who “bounced” if they performed this event. You can learn more about bounce rate in the post we’ve published on this subject.
Average Session Duration – How long, on average, visitors spend surfing through your website. If a visitor left your site from the very page they entered it from their session duration will be zero even if they had spent a long time on this page (this is due to a technical difficulty Goggle faces when trying to measure this length of time effectively).
All this data is available throughout the reports that are displayed on Google Analytics, you can use such data to monitor how relevant visitors to your site are.
The following explanations about features are in English, if you’ve set your Google Analytics user interface to another language you can reset it to English, but even if you keep it on the language you’re using it will still be easy for you to understand what we’re describing for each feature.
Creating a New Account and Setting Up Google Analytics For Your Website
Naturally, the first thing you must do is go to Google Analytics from your Google account. Once you’re in, click on Admin (at the top of the page). In “account” choose “create new account” and then “website” (assuming you are setting up Google Analytics for your website and not for an app). In the next screen fill out account name (which should be simple so that you’ll have an easy time navigating through different sites you are monitoring), then enter the site’s URL, the industry you are in and time zone. You will then receive a few lines of code which you will have to add to each of your website’s pages between <HEAD>and</HEAD>. Once you’ve added the Google Analytics code data collection begins and is displayed (data from before the code was added will not be taken into account) – data is available via the “reporting” tab.
Real-Time
One of the coolest features of Google Analytics is tracking what’s going on in your website at the moment. This data is found under the “Real-Time” side bar.
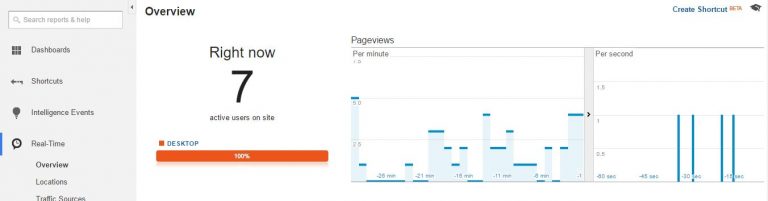
The Real-Time feature was launched during 2011 and quickly became one of the most talked about features among Google Analytics users. “Real-Time” allows you to check out how many visitors are surfing through your site at the moment, which pages they are on (content), where they came from (traffic sources). If you go to “Locations” you’ll get data regarding countries in which the visitors to your site are (at this very moment).
Real-Time is very useful when you’re running advertising campaigns. For instance, if you’re using radio broadcasted ads and want to know how they affect the traffic to your website, you can easily do this using the Real-Time feature. This is also true to any other “buzz” creating advertising, such as TV commercials.
Geographic and Demographic Data
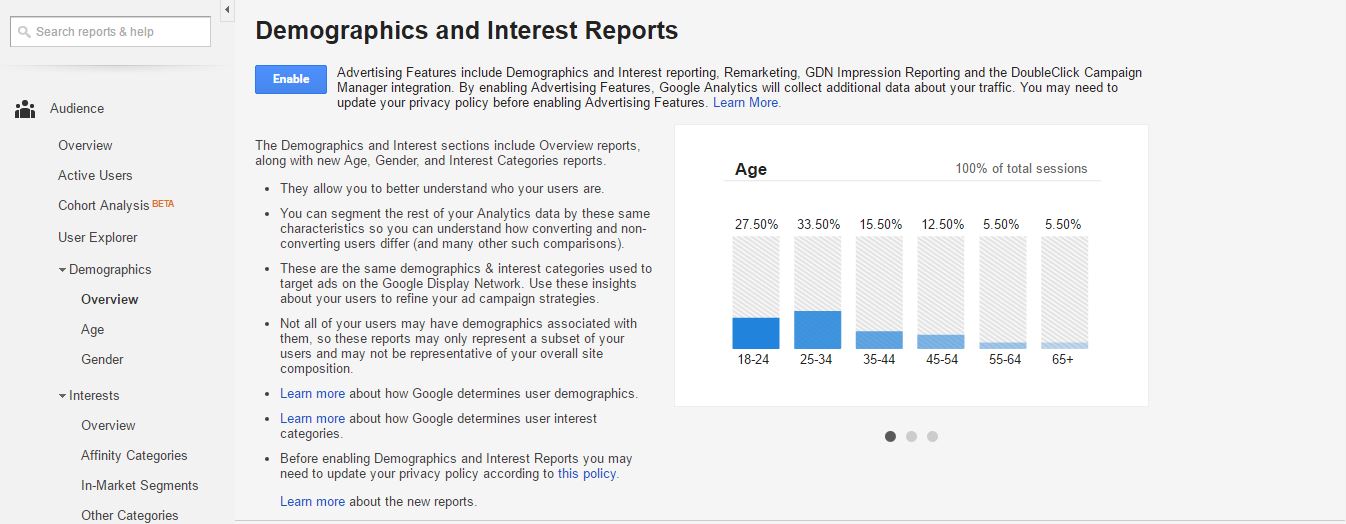
Have you always wanted to know who your website visitors are? Utilizing Goggle’s anonymous data collecting you can learn your audience’s approximate age, place of residence, the language they speak and even what their interests are.
In the menu under Audience -> Demographics you’ll find demographic data about visitors to your website. Before such data can be displayed you’ll have to activate the feature by clicking on “approve”. Once you’ve done this you will gain access to data about the age and gender of your audience.
For geographic data about your website visitors go to Audience -> Geo where you’ll find info about the language they speak (in “language” the data is based on the language visitors use on their browsers) and location by countries or even regions within them.
Behavior Segmentation
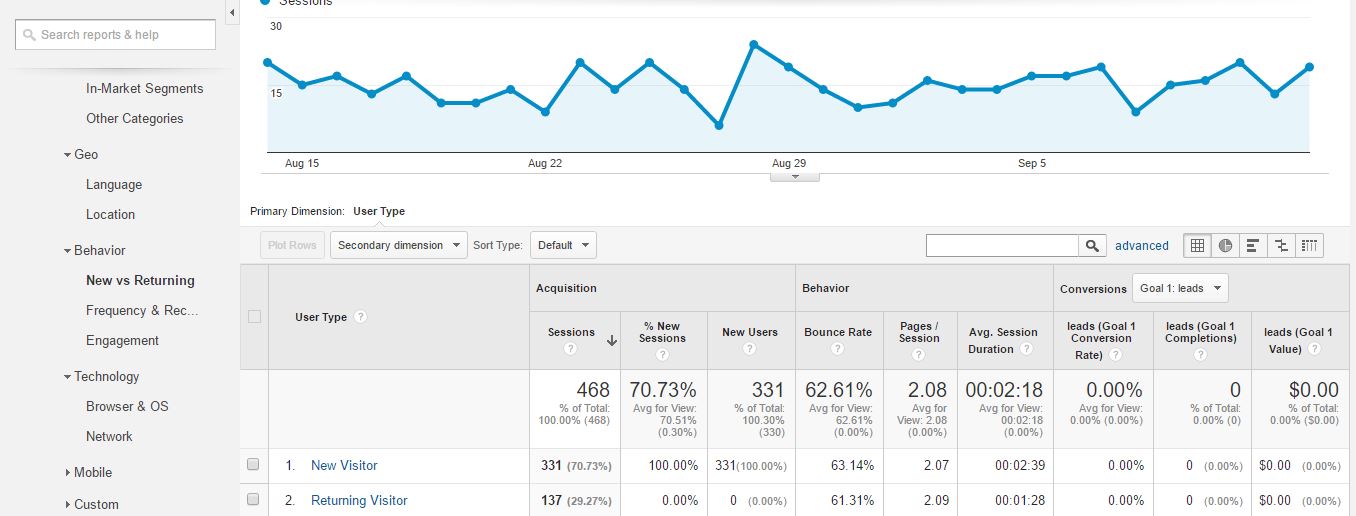
For learning about visitors’ involvement in your website go to Audience -> Behavior, under “New VS Returning” you’ll see data about how many visitors were ones who entered your website for the first time and how many were ones who had already visited it before at least once.
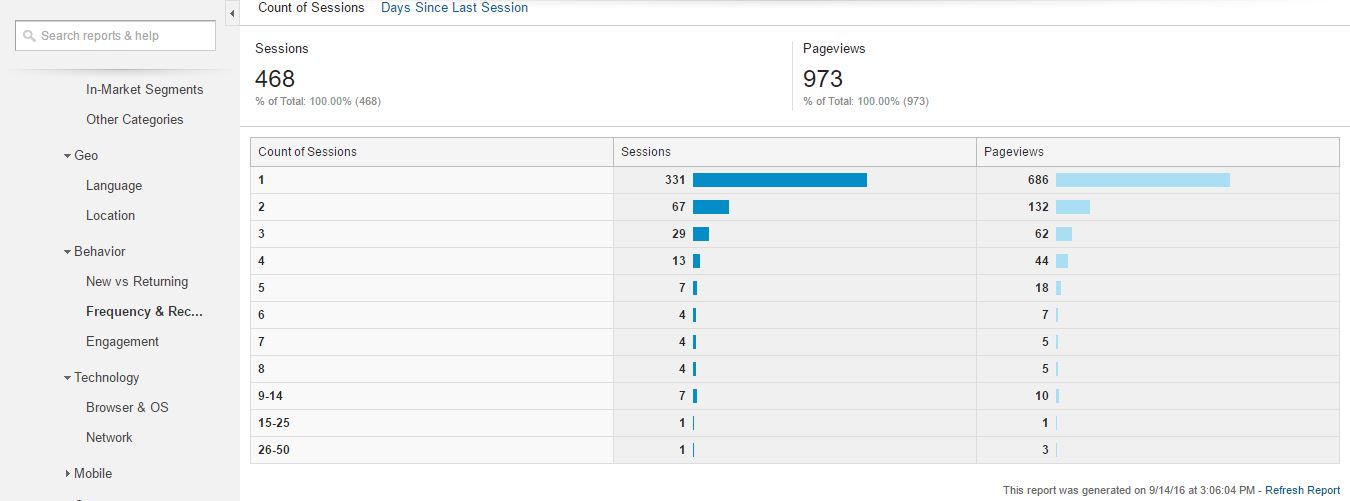
For more specific division of visitors according to how many times they’ve visited your website go to “Frequency & Recency” where you’ll find a table showing numbers of visitors by frequency of visits. In the example bellow 29 visitors visited the website exactly 3 times. Typically, as number of visits rises the number of visitors will fall.
Finally, under “Engagement”, you’ll find a similar display of visitors’ characteristics, this time, instead of by number of visits, by the amount of time they spent on your website.
Numbers of Visitors Using PCs, Smartphones and Tablets
Most website owners are aware that volume of traffic from mobile users has grown immensely over recent years, for many websites today the majority of visitors come from mobile.
In order to view segmentation by PCs (on Google Analytics PCs are referred to as “Desktop”), mobile and tablet go to Audience -> Mobile, under “Overview” you’ll find the above mentioned division displayed:
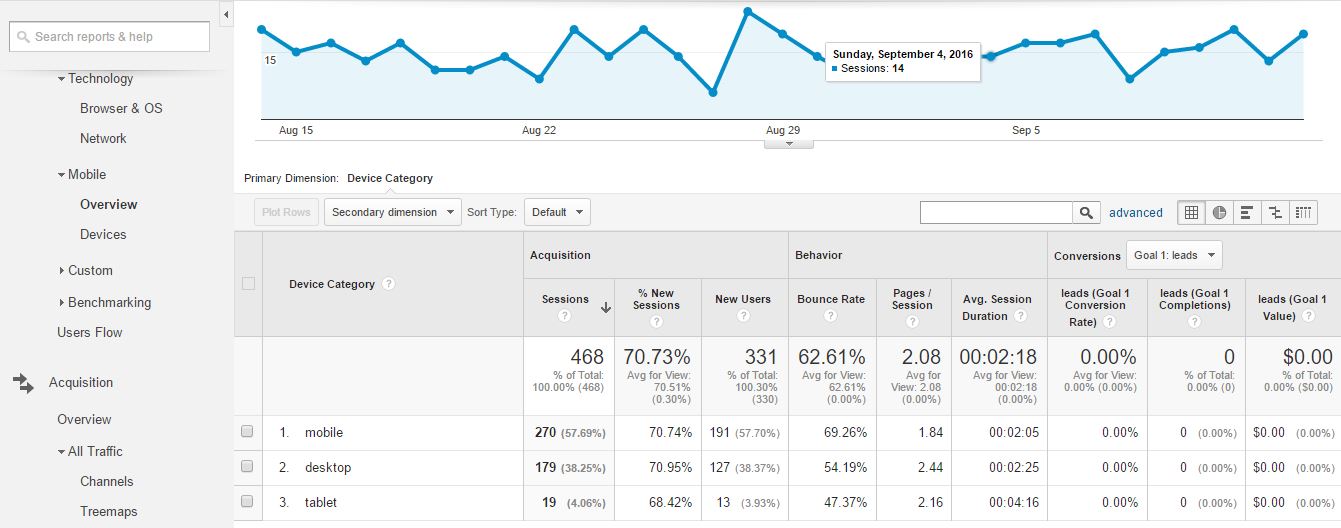
Most times this data will serve as a reminder as to how important it is to make your site user friendly for visitors using mobile phones. You can even get more specific information regarding which types of mobile phones they use under “Devices”.
Traffic Sources
Perhaps the most valuable information for a website owner has to do with where visitors to their site are coming from. The most common sources of traffic are organic search results (mainly on Google), PPC, social networks, referrals and direct traffic.
You’ll find information regarding traffic sources on Acquisition -> Overview
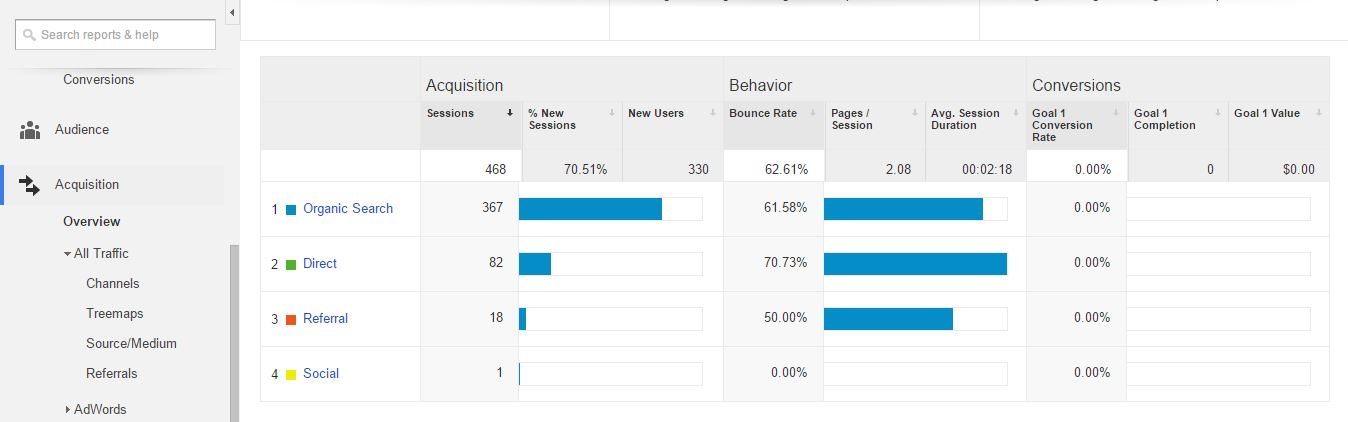
Here’s what this data means:
Referral – traffic from links to your site found on other websites. By pressing on “Referral” you’ll get a list of all the sites visitors came from.
Direct – visitors who entered your site directly, either by typing in its URL or from favorites on their browser.
Organic Search – all traffic from search engines is taken into account, Google, Yahoo, Bing etc. You can find the complete list here. Naturally, the main bulk of search engine traffic will be from Google. If you want to learn about the search words your visitors searched for when they found your site you’ll have to associate Google Analytics with your website through a Search Console account.
Social – traffic from social networks such as facebook, twitter, etc.
Paid Search – traffic from Google addwords campaigns including all its derivatives (search, media and more) or DoubleClick.
Behavior Flow
There’s a way in which you can check out how visitors move through your website’s pages, the most common funnels that is. You can do this from Behavior -> Behavior Flow
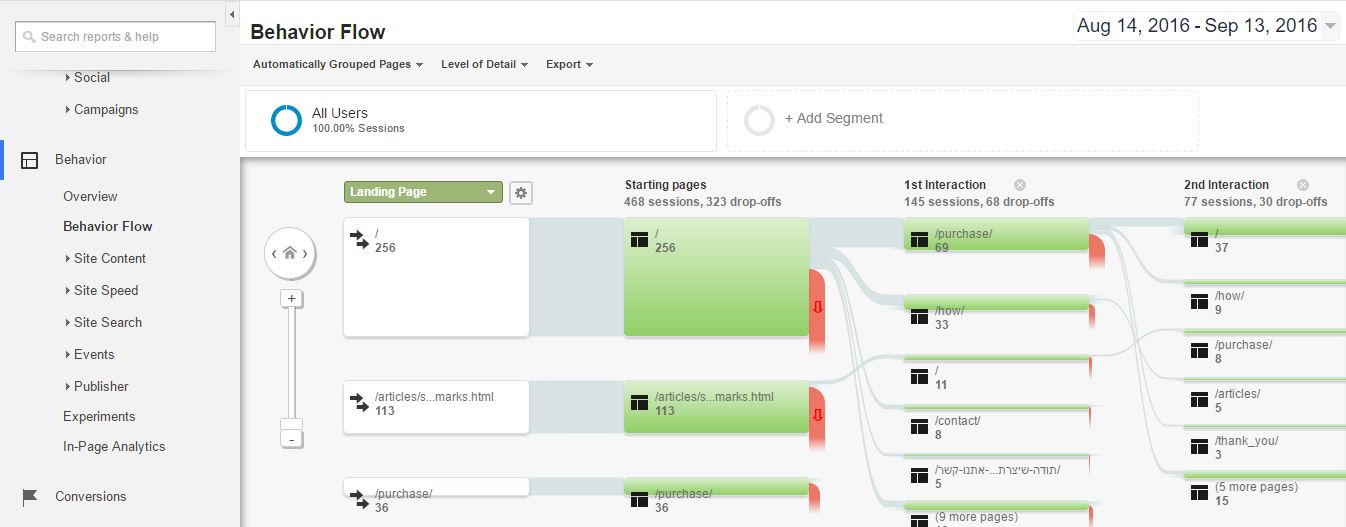
From this flow chart you can see how your visitors typically surf through your website, you can then make changes based on conclusions you come to. On one end of the flow chart you’ll find the page a visitor entered from, on the other is the page they left from and so on. Use the arrows at the side of the chart to move around and find out how many visitors navigated from one page to another.
Page Views, Landing Pages and Exit Pages
As website owners it is very important that you know which are the most popular pages on your website (the ones which are viewed the most). Such insight can help you improve your site in countless ways, such as finding out which content is most appealing and creating more such content. You can also work to improve the pages which are viewed the most so that visitors get even more benefit from visiting them, or you can think of ways to increase income such pages generate.
You can find such information on Behavior -> Site Content -> All Pages
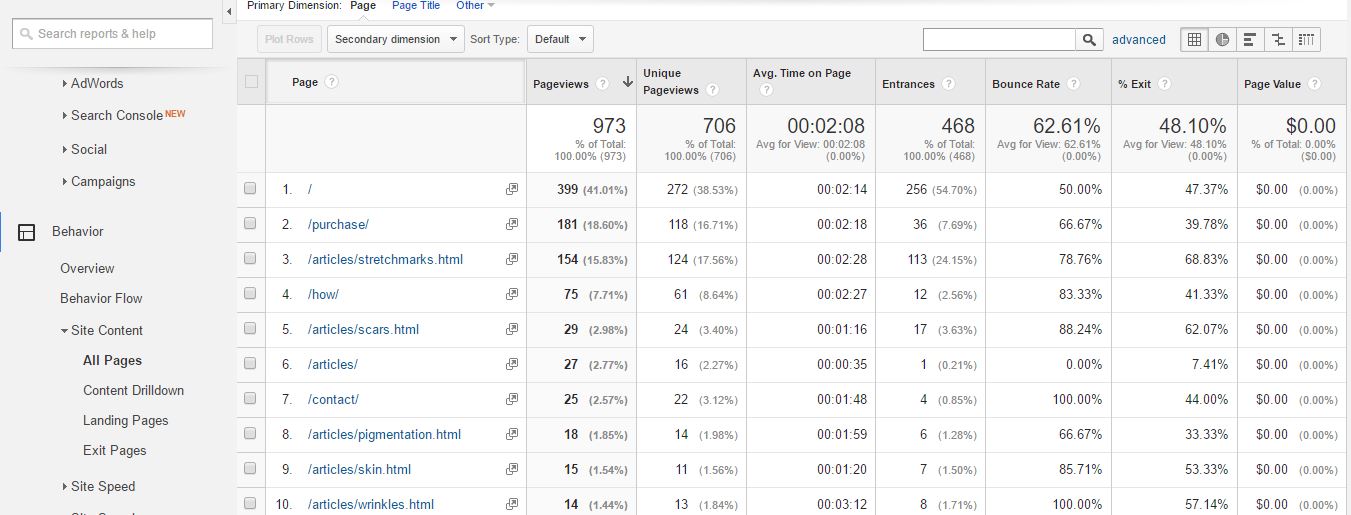
Further valuable information about the most viewed landing pages and most viewed exit pages is to be found in the same above mentioned tab under “Landing Pages” and “Exit Pages”.
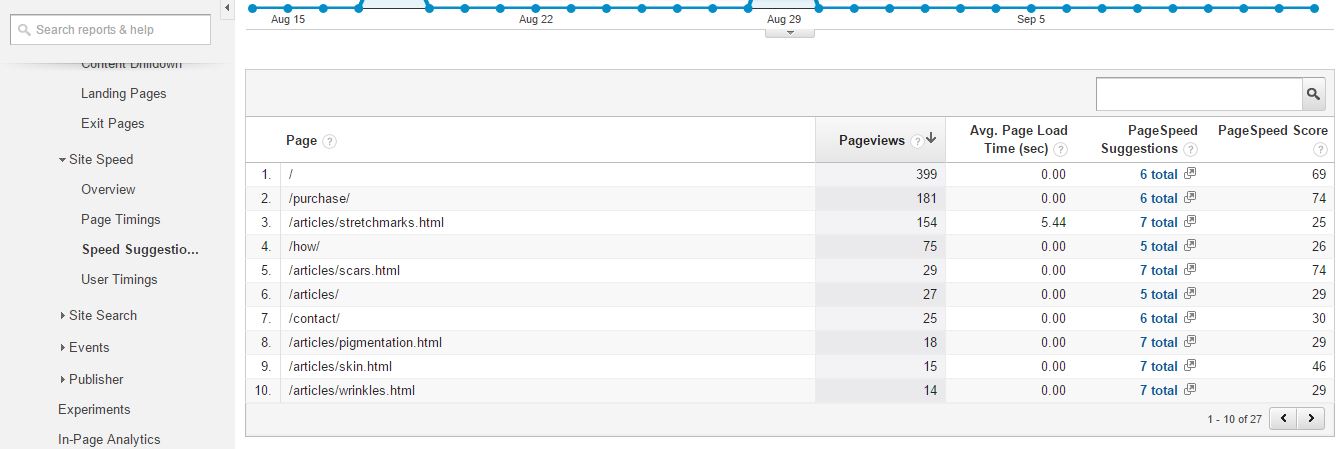
Site Speed Suggestions
This is a bonus part for those of you who’ve made it all the way through this post .
Google has developed a number of tools designed to help developers improve a website’s loading time. One of the most popular of these tools is “PageSpeed Insights” which offers suggestions for improving code in order to get website pages to perform better. Google Analytics allows integration of this tool and website visitors behavior. Using this integration enables you to get a speed rank (from zero to 100) for the main pages of your website, you can get tips for improving loading speeds with a single click. Access to this feature is from Behavior -> Site Speed -> Site Speed Suggestions:
In Summation
In this post we’ve learnt about basic features of Google Analytics all in order to allow you to begin using them. The next step is to monitor more and more stats!
The more you use Google Analytics the more you will be able to benefit from it.
Using Google Analytics you can get information about things like Conversions and Segmentation, you can create personalized Dashboards and much more. The Google Help Center is a great place to learn more about Google Analytics.
If you have any comments to add or any questions you want answered, you’re welcome to post them bellow!


