
Analyzing how your business is performing is a crucial aspect you need to consider regardless of the nature of the business.
However, when running a SaaS company, there are multiple metrics that you need to analyze before you come up with a clear report that depicts a clear picture of your business progress.
Remember that approximately 38% of the companies dedicated to offering SaaS solutions do not depend on monthly subscriptions but change users depending on their needs.
When creating a SaaS report, you must conduct multiple calculations regarding the business aspects you need to incorporate into the report.
However, many worries since they never like to engage in manual calculations due to the fear of making errors.
Thanks to the availability of computers since they can help facilitate the completion of all the essential measures that need to be included in the report.
This SaaS reporting guide offers all the essential information you need to help you compile accurate reports that the business stakeholders can use to transform the company’s performance. Let’s check it out!
Everything You Need to Know About SaaS Reporting
SaaS reporting utilizes a series of metrics to detect a SaaS company’s revenue growth rate. The metrics ensure that the company moves in the right direction.
In most cases, SaaS companies offer their customers various services facilitated using different software. However, the products offered are tangible and not downloaded on the web.
The software used to facilitate communication between the company and the market audience is created and maintained through the company servers.
When you ignore the essential metrics revolving around the company’s performance, you are avoiding crucial aspects likely to contribute to your business’s failure in the long run.
SaaS companies tend to grow at a faster rate. The only way you can compare the growth milestones achieved by the company is by comparing it with other similar-sized brands in the market.
Besides, all the metrics within the SaaS reporting segment are said to be static throughout the entire industry. However, some companies only measure specific metrics critical to their success.
Cohort Analysis
Cohort analysis enables the business stakeholders to address specific problems within the customers’ lifecycle.
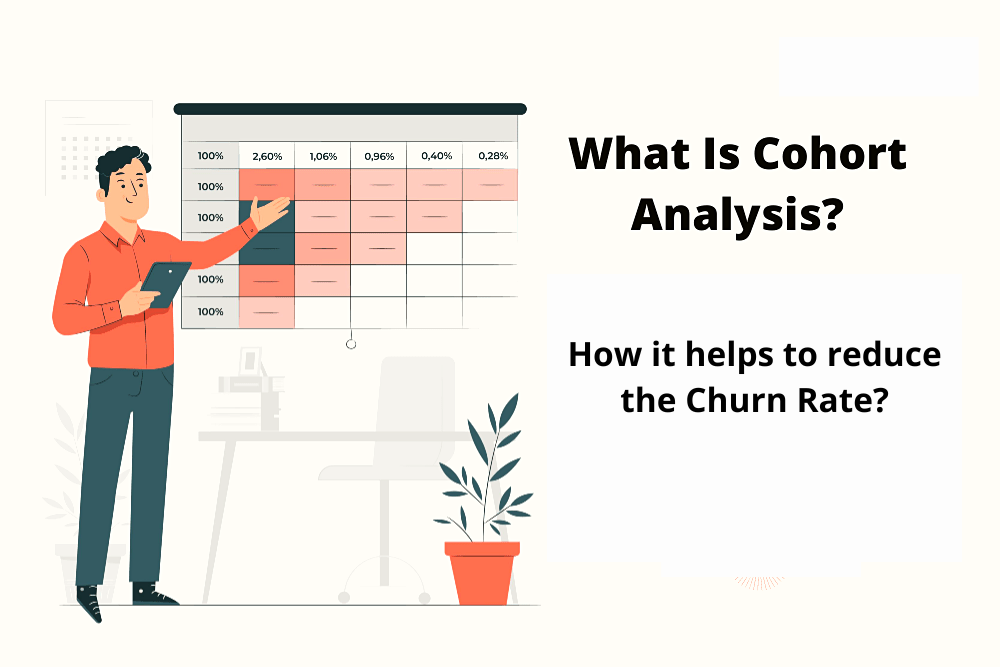
Rather than focusing on other metrics to give you a glimpse of the business growth, cohort analysis offers an actionable approach to how you can view data from different perspectives using visualization to analyze data by creating charts such as a dot plot chart, Sankey diagram, and funnel chart. A cohort mainly refers to the grouping of customers depending on specific criteria.
You can decide to group customers when they sign up with the company. Using these criteria allows you to monitor the customer churn rate, among other crucial metrics within the company.
If you note that the churn rate is relatively high by a particular percentage, you need to get the best way possible to bring it down.
Using cohort analysis, you are better positioned to evaluate the months when the churn rate is higher within the entire customer lifecycle.
This strategy can give you a better way of figuring out why customers tend to leave the company within the first months of joining. As a result, you will get the proper means to help reduce the churn rate within the shortest time possible.
Sales Metrics
Incorporating the sales metrics in your SaaS reporting is essential to help the sales team understand how they contribute to the company’s development. Also, this metric is critical in helping you understand your customers in a better manner.
When analyzing this aspect, you need to understand that other elements under it must be addressed in the best way possible. These are:
- The Customer Churn Rate and the Revenue Churn Rate
When you look at the surface of these two metrics, you may think they are used to address the same thing. This is not the case! Remember that the number of customers you lose converts to the amount of revenue you lose at the end of the day.
Besides, the customer churn rate mainly translates to the number of customers who opted to downgrade their subscription package involuntarily, mainly due to a missed and failed payment.
To calculate this metric, you need to determine the total number of subscribers you had at the beginning, especially within one month.
Once you have this number, you can then subtract the number of subscribers at the end of the stipulated period. Go ahead and decide the number you get on step two by the number of subscribers you had at the beginning of the period.
Also, you need to include the average revenue per customer (ARPC) within your sales reporting. This metric detects the total amount of money a company can expect from a single customer depending on how regularly they purchase products from your company.
It also plays a massive role in helping the company understand more about the customers’ spending habits and how to improve sales efficiency, especially when combined and integrated with software and tools such as ERP/manufacturing software, financials, commerce, inventory management, and HR.
Ways to effectively analyze churn data
In this part of the blog, we have provided you with several ways to analyze your customer churn data. Let’s look at them from a deeper perspective.
a. Customer retention rate
This is one of the effective ways to analyze churn data. It provides data and percentages of the number of customers that stay in business.
b. Customer satisfaction score
The customer satisfaction rate is among the effective ways to analyze churn data. It enables you to know what your customers like or don’t like. It also provides reasons why customers do not select a product or service.
c. Customer churn rate
It allows you to know the number of customers you lose every month. It enables you to act according to the number of lost customers.
d. Customer engagement rate
It analyzes how customers behave in your business. It also explains how familiar your customers are with your products. This may promote engagement if customers interact more with your product or service.
How to reduce customer churn
Research says that 97% of users churn silently. This makes it a bit difficult to understand the reasons behind the churn. Let’s discuss some practical ways to reduce customer churn;
Identify why customers churn
Conduct research on your business using a product analytics tool. Confirm your hypothesis and solutions of your products for you to get answers
Find solutions that will help in reducing customer churn
Begin to make changes after testing your hypothesis. Analyze impacts and optimize to a level where you have improved products and created customer journeys.
The Customer Acquisition Cost (CAC)
Every business needs to understand the cost and effort it takes to acquire new customers. The basic formula to calculate this metric is dividing the total sales and marketing spend by the total number of customers you have received within the same period. Also, you need to know other essential calculations are closely related to CAC, such as the Cost of Goods Sold (COGS).
- The Months it Takes to Recover the CAC
This is the period it takes to generate enough money to cover the cost of acquiring new customers. This feature is calculated by dividing the CAC by the MRR and multiplying the number by the gross margin percentage. The Months it Takes to Recover the CAC.
- The Gross Margin
The Gross margin is the calculation of the general business revenue subtracting the total cost of the business operations. You need to ensure that the cost of operation is calculated across all the business departments.
Conversion Rates
When evaluating some key SaaS metrics, the conversion rate stands at the top of the mountain. This metric is meant better to understand the efficacy of your products and services. Also, you can evaluate the value offered by the products and services you provide to your market audience.
Besides, there are other essential SaaS conversion rate metrics that you need to know. Let’s check them out!
- Base Conversion Rate
This conversion rate can be calculated using Google analytics, even though you can also use the manual approach. You can calculate this by taking the number of all the website visitors and dividing it by the number of conversions recorded within a specific duration.
- Lead Sale Conversion Rate
Remember that the SaaS marketing team utilizes leads to facilitate their daily operations. They make this happen using the lead fill forms displayed on social media, content marketing, and organic search.
Once the leads are acquired, they are filtered by the sales and marketing team and introduced back into the business operations.
Final Verdict!
When running a SaaS business, you need to focus on reporting based on key metrics. Approximately 30.4% of customers prefer spending much of their money on SaaS brands due to their reliability.
The only way to prove that you are reliable is by making in-depth reports focused on the key metrics to help you build trust between the company and the market audience.
The metrics outlined in this guide offer an expansive working playground where you can generate a compelling report suitable for your readers and the entire market audience.


